Product
Event Storming Tool

The Collaborative Event Storming Tool Your Team Needs

Follow our walkthrough to map your first workflow in minutes
and see the power of AI in action.
A screenshot of an Event Storming session for an e-commerce platform on a digital whiteboard.

Searching for the right Event Storming tool?

Whiteboards can be messy and hard to manage for remote teams. Qlerify provides a dedicated online Event Storming tool that enhances collaboration, provides structure, and uses AI to accelerate your design process from start to finish.

To get started, log in to Qlerify or sign up for free, create a new project, and follow this step-by-step guide. We will walk you through the detailed steps of conducting a Software Design-level Event Storming session in Qlerify.

For a deeper dive into the method, you can also read our complete article on the topic: Event Storming - The Complete Guide.

Step 1: Create a new Workflow

Create a new, empty Workflow and open it. You should see a view similar to the image below. This is your blank workspace, where you can Add a starting point, Generate a workflow with AI, or review and update Settings. You can also invite team members to collaborate on the project.

For more details about this view, click the question mark icon.

A screenshot of the initial Qlerify workspace for creating a new diagram. Green callout boxes with arrows highlight the 'Workflow settings' icon (a gear) and the 'Help' icon (a question mark) in the main toolbar. The central canvas provides two starting options: 'Add start point' or 'Generate workflow with AI'.

Step 2: Review card types

Open the Settings by clicking the cogwheel above the Workflow diagram, then select the Cards tab.

When you create a new Workflow in Qlerify, a default set of card types is provided. These can be used for Big Picture, Process Modeling, and Software Design-level Event Storming. You can add, update, and remove card types based on your needs. The default setup includes the following card types:

The 'Card Type Settings' screen within the Qlerify application, which allows users to customize the properties of the digital sticky notes used in their diagrams. The menu shows a list of card types, including 'Command' (blue), 'Aggregate Root' (yellow), 'Read Model' (green), and 'User Story' (purple), with options to configure their names, colors, and behaviors.

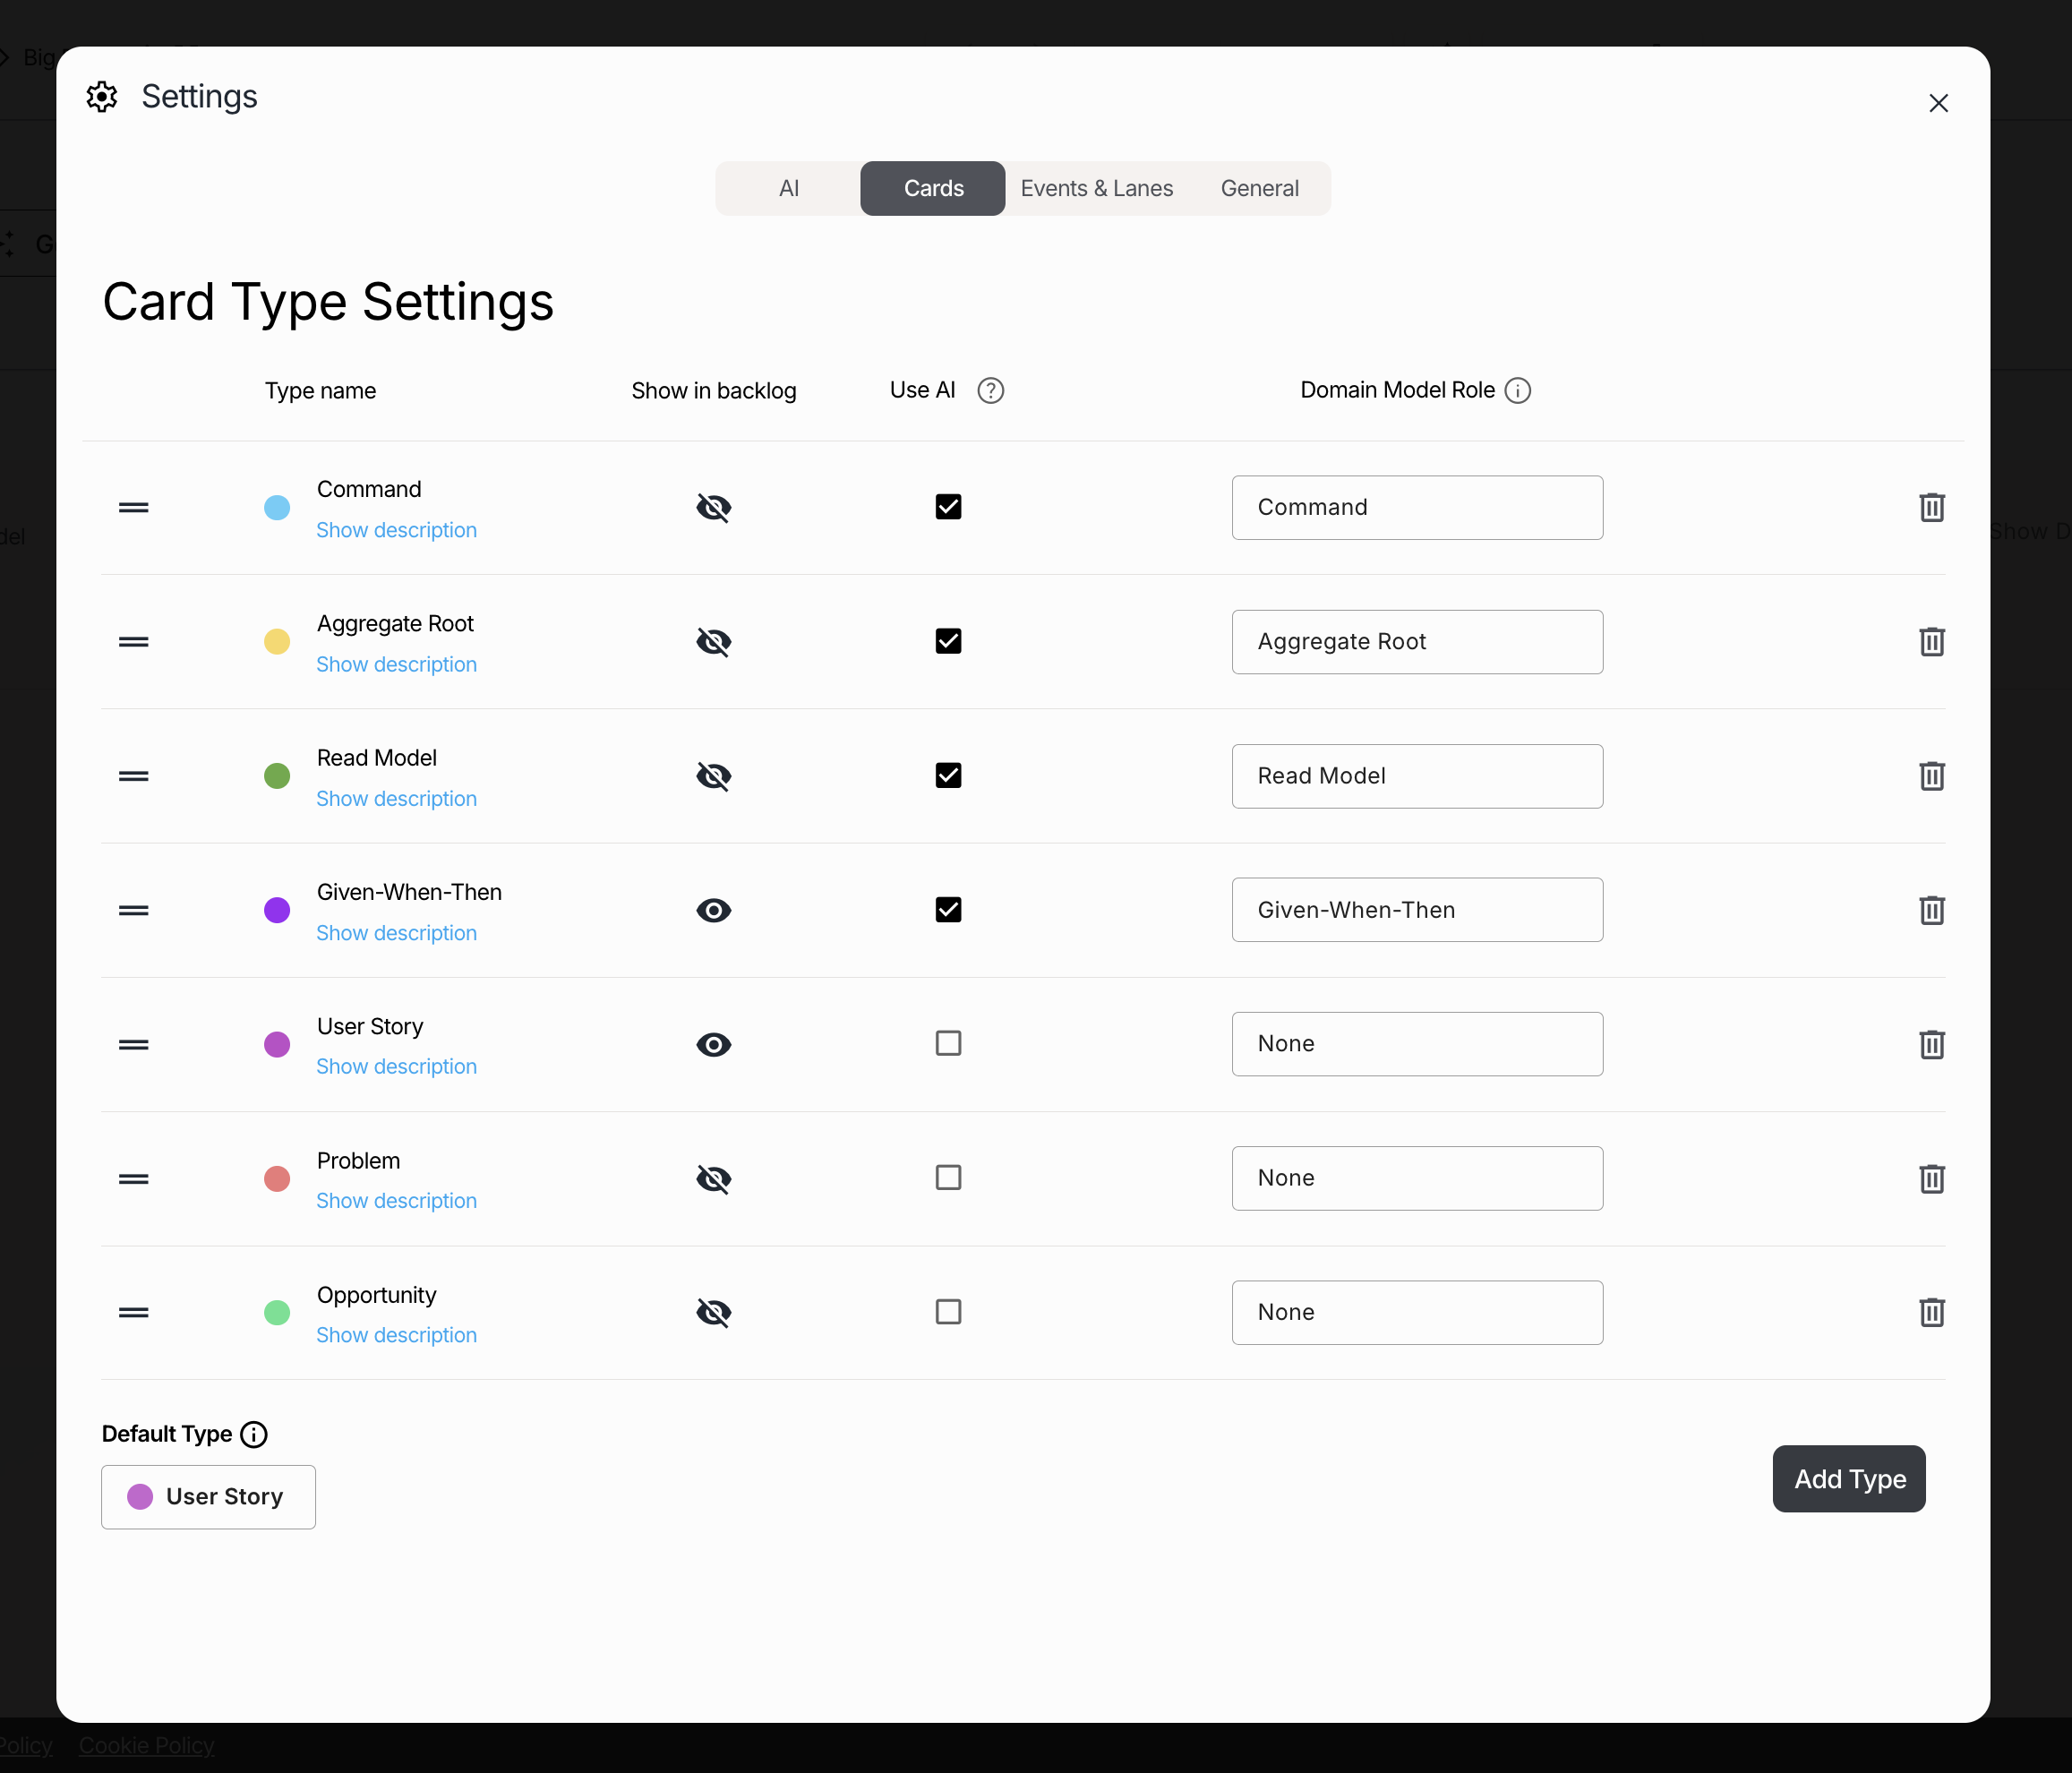
The card types Given-When-Then and User Story are not typically part of standard Event Storming. However, if you want to enhance your Software Design session, feel free to include Given-When-Then (GWT). In this example, though, we will leave them out.

Go ahead and update the Card Type Settings:

  • Show in backlog: Under this heading, make Problem and Opportunity visible in the backlog by clicking the eye icon to remove the strikethrough line. This allows us to prioritize Problems and Opportunities at the end of the session and plan them into iterations.
  • Use AI: Under this heading, untick Given-When-Then and Read Model. Tick Problem and Opportunity. This ensures that AI generates Problems and Opportunities instead of GWTs and Read Models.
  • Command: Under this heading, make sure the type Command is selected.
  • Aggregate Root: Under this heading, ensure the type Aggregate Root is selected.
  • Rename the card type Aggregate Root to only Aggregate (because we are doing Event Storming and not building a full Domain Model). Update the description to:
    • "The aggregate that the command is invoked on in this step of the process."
A detailed view of the Qlerify 'Card Type Settings', showing the editable description for the 'Aggregate' card type. The description field is open and contains the explanatory text: "The aggregate that the command is invoked on in this step of the process." This demonstrates how users can add custom help text for each card in their workflow.
Note: There are three special card types (Command, Read Model and Aggregate Root) that we use to be able to group Commands and Events around Aggregates at the end of our Software Design session.
Note: If you think Aggregate is a confusing term, feel free to change it to something like "Entity" or "Information Object".

Finally, you can review—and update if needed—the descriptions of each card type by clicking Show description. These descriptions are used for AI prompting.

Step 3: Generate with AI

You can generate full workflows with AI whenever you start with a blank canvas by clicking "Generate Workflow with AI". Once you started adding events to a workflow, this button will no longer be visible.

There are several LLMs (Large Language Models) available for you to use. In this example, we used ChatGPT-4o. You can select your preferred LLM from several options in the workflow Settings (under the AI tab).

Click on "Generate Workflow with AI", then click in the text area at the top of the dialog. Now select "A CRM process used by Salesforce." from the list displayed. Feel free to modify it to make it more detailed if you want:

  • Example of a simple prompt: "A CRM process used by Salesforce."
  • Example of a more detailed prompt: "A CRM process used by Salesforce, including the steps: Lead created by Sales Person, Lead qualified by Sales Manager, Opportunity created by Sales Person, etc."

Next, deselect all three checkboxes "Generate Command..", "Generate Entities.." and "Generate Read Model..". These are used for Event Modeling and Domain-Driven Design. Now click "Generate Workflow."

The 'Generate workflow with AI' screen in Qlerify, where a user has described a business process as "A CRM process used by Salesforce." The interface shows a checklist of different card types (like 'Command', 'Aggregate', and 'Problem') that the user can select or deselect to have the AI generate for their workflow. A green callout box highlights the user's ability to customize the AI output by deselecting cards.

Once the AI generation is complete, you may end up with a result similar to the example below, though the variation can be significant.

A screenshot of an AI-generated Event Storming diagram in Qlerify that illustrates a CRM sales process. The workflow is organized into swimlanes for different roles like 'Sales Rep', 'Sales Manager', and 'Customer'. The diagram maps the sequence of events with orange sticky notes, starting from 'Created lead' and flowing through steps like 'Qualified lead' and 'Approved opportunity' to the final 'Accepted quote' from the customer.

Step 4: Collaborate

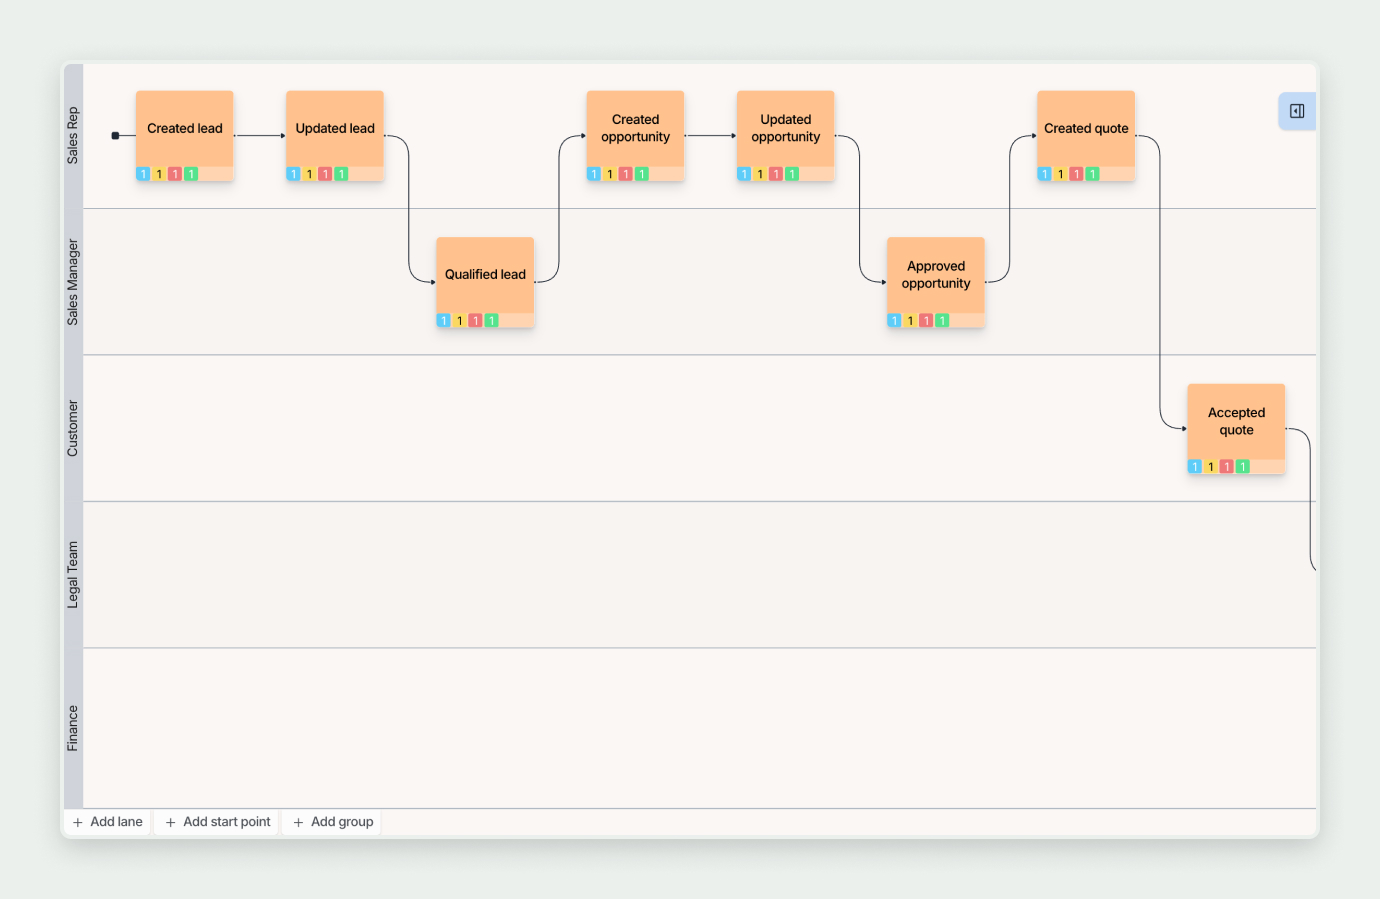
Now, collaborate with your team by going through the workflow step by step to ensure each step is correct. You can invite all your team members to Qlerify for real-time co-editing. Sometimes, it’s best if one person navigates the tool while others contribute verbally. This depends on the situation and your facilitation style.

Start with the first event, "Created Lead," and follow these steps:

  1. Review Event: Is the event correct, or should another event come before it? Qlerify makes it extremely fast and easy to rearrange events using drag & drop. You can also generate or manually add new events using the menu that appears under a selected event.
A close-up screenshot of the Qlerify diagram editor, demonstrating how to add new steps to a workflow. In a CRM process diagram, the 'Updated lead' event is selected, which reveals a contextual toolbar. Green callout boxes point to two specific icons on this toolbar, highlighting the options to 'Add Event' manually or 'Add Event with AI'.
  1. Check Actor / Role: Qlerify uses swimlanes to represent actors or roles, making it easy to see each participant’s involvement in the process. If the swimlanes are incorrect, you can:
    • Rename swimlanes
    • Reorder swimlanes
    • Add new swimlanes (use the button under the diagram)
    • Drag and drop events between swimlanes
A screenshot of the Qlerify editor highlighting how to manage swimlanes within a diagram. In a CRM process workflow, two green callout boxes point to key features: the first box, labeled 'Rename swimlane,' points to the title of the 'Sales Rep' lane, while the second, 'Reorder swimlane (visible on hover),' points to the up-and-down arrow icons used to change a lane's vertical position.
  1. Open the Sidebar: If the event (e.g., "Created Lead") is correct, select it and open the sidebar if it’s not already open.
A screenshot of the Qlerify interface with the main diagram blurred in the background to focus on the details sidebar. A green callout box labels this panel as the 'Sidebar'. The sidebar is open for the 'Created lead' event and shows its associated child cards, including the 'Command' (Create Lead), 'Aggregate' (Lead), 'Problem' (Incomplete lead info), and 'Opportunity' (Automate lead capture).
  1. In the sidebar, update the Command name if necessary. If you’d like to modify the AI-generated Aggregate name, you can do so as well.
Note: In Software Design Event Storming, each event should correspond to one state-changing command that operates on a single aggregate. If an event is not state-changing, consider leaving it out. If one event corresponds to multiple commands, split it into multiple events.
Note: When updating the Aggregate, a combo box will appear, allowing you to generate entities. At this stage, we will not generate entities but instead use a free text label for the Aggregate name. For more details on using Entities, see our articles on Domain-Driven Design and Event Modeling.
  1. Identify Hotspots (Problems and Opportunities): What are the problems and opportunities in this step of the process? Discuss with your team. Add new Problems or Opportunities manually or with AI. You can revisit and iterate over all cards later.
  2. Decisions / Policies: In the original Event Storming method, a policy (purple card or “lie detector”) must be placed after each event. In Qlerify, we have chosen to use Decisions / Policies only when there is a branching point in the process. Some might think this is incorrect, but in our experience, this approach works well in practice.
    • Add decisions only when there is a branching point—don’t overdo it.
    • We recommend modeling the most valuable path first (the "happy path") before adding too many branches.
A Qlerify diagram demonstrating how to model a decision point in a workflow. A purple, diamond-shaped 'Decision' node has been added to the 'Sales Manager' swimlane, asking the question, "Lead status is qualified?". The process then branches into two paths: a 'Yes' path leading to the 'Created opportunity' event, and a 'No' path leading to a 'Lead closed' event. A callout box explains that these path labels answer the question posed in the decision.
  1. An Alternative Approach to Decisions: Sometimes, it’s easier to use another approach to decisions. Instead of placing a decision after an event, you can add a Given-When-Then (GWT) condition to the next event to specify what is required in order for the workflow to continue.
A screenshot from the Qlerify application demonstrating how to document a business rule using a 'Given-When-Then' card. The 'Created opportunity' event is selected in the main workflow, with its details open in the sidebar. Arrows connect the preceding 'Qualified lead' event to the 'Given-When-Then' card in the sidebar. A callout at the bottom summarizes the rule: "The selected event 'Created Opportunity' can only happen if the lead is qualified."

Step 5: Iterate

Now, repeat Step 4 for each event, refining your workflow iteratively. You don’t need to complete everything in a single session—you can revisit your workflow and refine it in separate sessions with different groups of people.

Things to Keep in Mind:

  • Begin by completing the most valuable path (the "happy path"), then move on to the most important alternative paths.
  • In Qlerify, events are always displayed either fully to the left or directly after a vertical divider. All other events will be positioned one step to the right of their parent event. Although this might take some time to get used to, it makes modeling extremely fast once you’re familiar with it. You'll never waste time manually rearranging lines and boxes again!
A screenshot of a complex Qlerify diagram that is organized into 'Phase 1' and 'Phase 2' using a vertical divider. The diagram maps two parallel workflows: a sales process and a customer support process. A callout points to the dividing line, explaining it is a 'Vertical divider, can be dragged horizontally'. Another callout explains a layout rule: 'Starting points displayed fully to the left or after a vertical divider'.
  • You can introduce new starting points by clicking "+ Add start point" under the diagram. These can be merged with existing events as needed.
A screenshot highlighting the main toolbar at the bottom of the Qlerify canvas, with a customer support workflow shown in the background. Two green callouts point to buttons on the toolbar: one points to the '+ Add start point' button, used to begin a new process flow, and the other points to the '+ Add group' button, used for grouping elements.
  • Click "+ Add group" once to create a new group or twice to add two groups separated by a vertical divider. Align events horizontally by stacking them at the beginning of a group. We recommend using Groups to divide your canvas into separate Phases or Stages.
A screenshot of a Qlerify workflow demonstrating the 'Group' feature. A sales process is organized into two groups, visually represented as 'Phase 1' and 'Phase 2' and separated by a vertical line. The event cards in Phase 1 are green, while those in Phase 2 are orange. A callout box above explains the concept: "Groups separated by a draggable vertical divider."

Step 6 (Optional): Read Models and Commands

Qlerify offers powerful support for defining Entities, Read Model Attributes, and Command Attributes. For more information on these features, see our articles on Event Modeling and Domain-Driven Design (links in the footer).

Step 7: Aggregates View and Bounded Contexts

Qlerify provides an instant view of Commands and Events grouped around Aggregates. This view is located under the workflow diagram in the Domain Model tab.

The view might look similar to the image below. Each command (the blue boxes) has its corresponding event on the right side, aligned at the same height. Here, you can see a summary of your aggregates and the commands available on each aggregate.

A screenshot of the 'Domain Model' view in Qlerify, which organizes the system's logic into a structured table with columns for 'Role', 'Command', 'Aggregate', and 'Resulting event'. A green callout box labeled "Create / Select Bounded Context" points to a button under the 'Lead' aggregate, highlighting the feature for assigning parts of the model to a specific Bounded Context.

The next step is to assign a bounded context to each aggregate. To do this, click "Select bounded context." After creating and selecting bounded contexts, for example Lead Management and CRM, the view may look something like this:

A screenshot of Qlerify's Domain Model after it has been organized by Bounded Context. The model is visually separated into two boxes: one for the 'Lead Management' context and another for the 'CRM' context. A callout clarifies, "Each box represents one bounded context." Another key callout explains that this is a "Code generation view for one Bounded Context," highlighting a primary benefit of this modeling approach.

Step 8: Wrap Up

You have now captured the workflow and identified bounded contexts, aggregates, commands, actors, problems, and opportunities (and maybe even some GWTs). You have built the foundation of the domain model.

Now, you can further refine your model by specifying entities, read models, and write models in detail. For more information, see our articles on Event Modeling and Domain-Driven Design.

As a final step, review the identified problems, opportunities, and GWTs, and plan them into iterations.

You can use either the Backlog or the User Story Map view. In this example, we use the User Story Map, which is located in a tab under the Workflow.

  1. Assign Problems, Opportunities, User Stories, or GWTs to releases.
  2. Use the filter above the diagram to focus on one or multiple releases and see how the planned improvements impact the end-to-end workflow.
A screenshot of the User Story Map feature in Qlerify, which links a process diagram to a release plan. The top half of the screen displays a sales workflow, while the bottom half organizes related work items (like problems and features) into horizontal lanes for 'Release 1' and 'Release 2'. A callout identifies the 'Release 1' lane as the "First iteration," and another highlights the menu option to "Change release" for a work item.
Best practices for Event Storming
  • Capture Events that represent ONE state change in ONE system.
  • Exclude events that don’t affect a system. For example, "Customer welcomed to meeting" is important socially but unlikely to trigger a system command.
  • Split broad events into multiple state changes. For example, instead of "Order Processed", use "Order Validated", "Payment Captured" and "Order Packed".
An abstract diagram showing four parallel, horizontal sequences of colored squares. Each row represents a different workflow or timeline using various colors like green, orange, blue, and purple, and the sequences vary in length and complexity.

Getting Started with Event Storming

At Qlerify, we have extensive experience with Event Storming and offer Qlerify, a unique cloud-based tool designed for this methodology. Sign up today using the link in the footer!

We also provide open and custom courses on Event Storming, in partnership with NFI. More information about the course can be found here: Event Storming Course

Need help getting started? We facilitate on-site and remote Event Storming workshops.

Contact us via the form in the footer to explore how Event Storming can benefit your organization!

Read our blog post about Event Storming in Swedish.

///SOCIAL SHARE